
You may have noticed that NinjaTrader can take quite a large amount of resources on your computer. And even if it’s not using a huge amount of the total CPU, it may be creating sluggishness in NinjaTrader or other applications running on your computer.
Here are a few quick and more elaborate tips to try to help reduce the CPU and GPU impacts of NinjaTrader.
Use Bars rather than Days in DataSeries specifications (Reduce total number of bars)
When specifying how much data to load in your charts, the more you load, the more calculations and memory that NinjaTrader has to manage. When you specify the amount of history you’re loading in terms of Days, the number of bars that are drawn are automatically calculated for you. And this can result in a lot more bars than you realize. For example, if you specify 200 Days of history in your data series, that equates to 200 bars on a daily chart. If you then switch to a 5 min chart, you’ll get 75 times more bars, or 15,000 bars. With Renko, this is even more dramatic, especially with the NQ. Loading 20 days of data in NQ Renko can generate over half a million bars in that one chart alone.
To easily resolve this, don’t specify your history requirements in terms of Days – use Bars instead. If you specify 1000 bars, you’ll get 1000 bars of history whether it’s in Days, minutes, or Renko bars. Try it – you might be surprised how much more responsive your charts are, and how much faster they will load.
Reduce the Number of Charts You’re Using
Each chart takes up quite a bit of time. The more charts you have, the more time, so close charts that you never use.
Close (we mean, really close) Workspaces You’re Not Using
This is probably one of the biggest oversights that many NT users have. You may think that you only have one workspace open, but just because your workspace isn’t showing doesn’t mean it’s not open (and using resource). NinjaTrader has three states for workspaces: open & viewed, open & not viewed, and closed.
How do you know what state each of your workspaces are in? In the NT Control Panel, click on your Workspaces menu. It will show you a list of all your workspaces. Look to the left of each workspace name, and you will see the workspace status. If the workspace is open and being viewed, a green workspace icon will appear to the left, as shown with the “Just MQ Gravity Lines” workspace in the below image. If you see a grayed-out icon to the left of your workspace, the workspace is not being viewed, but it’s still OPEN and using resources. If you see no icon at the left of a workspace name, then that workspace is closed, and is no longer using resources.
To close a workspace, hover your mouse over the workspace name and a set of selections will appear on the right. If the workspace is open, you’ll see a close option, as shown for the Real Renko and Time workspace in the image. Click close to close the workspace so it’s no longer running in the background and using resources.
Note that only one workspace can be viewed at a time, and if you would like to have the ability to quickly switch from one workspace to the next, then you may want to keep more than one workspace open, switching quickly between them via the Workspaces menu. And again, the currently-viewed open workspace will be shown as green. But if you’re not using a workspace, it might be helpful to close them out.
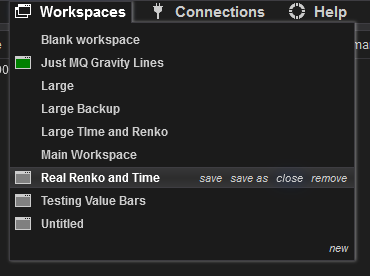
In the image above, 4 workspaces are open and consuming resources, one of which is being viewed. 5 are not open, and are not consuming resources.
Remove Unused Drawings from your Charts
Everything on your NT chart uses up CPU – even lines, labels, and yes, drawings (e.g. trendlines). If you aren’t using them, removing them will prevent them from using CPU. Note that this amount is likely negligible, but they can add up, and we’ve seen some cases where a horizontal line or label is using up a lot of CPU.
Make Sure You Don’t Have Duplicate Indicators Running
This applies in two ways. First, you want to make sure that you don’t have the same indicator running twice on the same chart unless there’s a reason (e.g., using EMA twice with two different lengths.) If you’ve added MQ MZT twice to your chart, you may not notice that it’s running twice, as the plots will be overlapped. If it’s running more than once on a chart, it’s not adding any extra value, but it is using extra CPU power.
The second way you may not want to have duplicate indicators, is that there may be cases where the same information from an indicator is being plotted on more than one chart. This is more likely when an indicator plots similar values on whichever chart it’s added. For example, MQ Gravity Lines shows the same values on all charts for everything but the Sapphire levels. If you’re primarily using MQ Gravity Lines for the Mid and Gold levels, you can use it on just one chart and reference that one chart whenever it’s needed.
Use Calculation Setting On Bar Close or On Price Change
When configuring your indictors, be selective about which indicators you set to update more then solely at the close of the bar. When possible, set Calculate to on bar close, when the only time the indicator updates is at the close of the bar, just as it’s moving to the next bar. The downside of this is that you won’t see the indicator update on the current bar. If you must see the very latest value of the indicator intrabar, then on price change is preferred. Only use on each tick when warranted, such as with an indicator that needs to count every tick, such as a ticks-left counter. Using on price change will usually suffice, and should result in fewer calculations being made by that indicator, as it will only update when price changes.
Fine Tuning: Windows Graphics Performance Settings (USE AT YOUR OWN RISK!)
A more advanced option for some to try would be to specifically set the graphics processing priority for the ninja trader executable. This is done via the Graphics Settings tool within the Windows Control Panel. To adjust a program, like the NinjaTrader executable, click on the Browse button to find the exe file. Make sure you know how to find the 64-bit version if that’s the one you’re using (it’s in the bin64 folder).
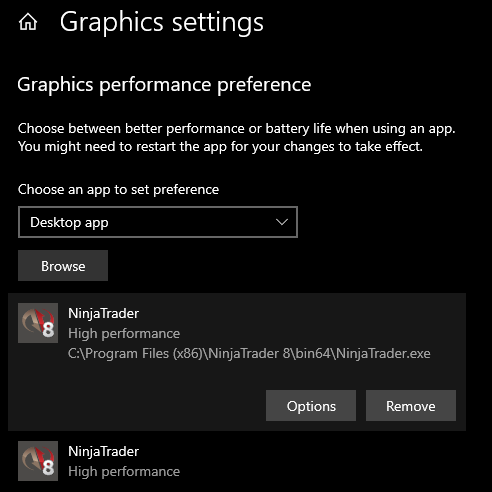
Once you add the executable to the control panel, you can set its graphics performance preference by clicking on the Options button, as shown above. You’ll be presented with the window similar to the one below, giving you the default option of letting windows decide, or choosing the Power saving or High Performance modes of the available graphics cards in your system.
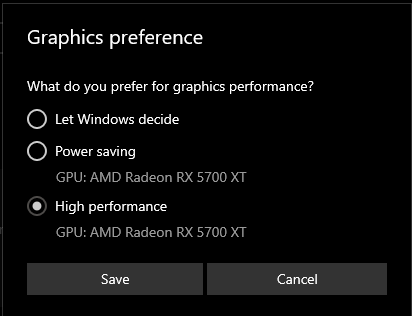
If you decide to try out this specific tuning, verify that NinjaTrader actually performs better, and that all features and expected graphics are present. If not, you can switch it back via the same control panel to Let Windows decide, or even click the Remove button and you’re back to the default graphics performance setting for the app.
Note that if you do use the High Performance feature, it will consume more power than the Power Saving setting, which could be impactful on battery life on laptops.
Clearing the Cache
NinjaTrader doesn’t have a simple way to clear the cache other than deleting the contents of certain folders. Rather than go into details of what that would include, here’s a link to an article that describes the details for NT8. Search the NinjaTrader support forum for NT7 instructions.