If your TradeStation charts are vertically compressed to the point where you can hardly see the price bars, then it’s likely that TradeStation is trying to fit something that’s plotted far away from price.
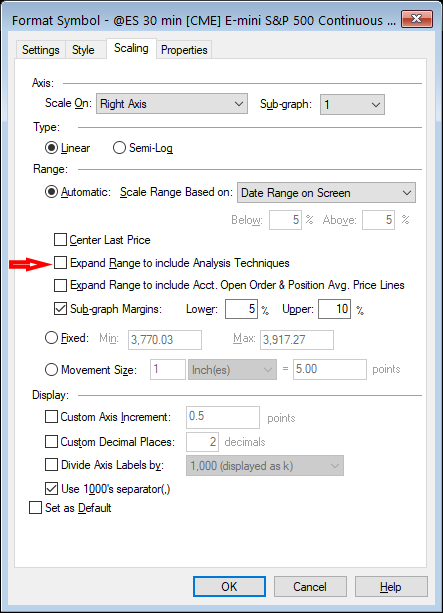
If you bring up the Format/Symbol dialog box, the Scaling tab has an option to Expand Range to include Analysis Techniques. This selection is pointed to by the red arrow in the image, below. When this is checked, TradeStation will expand the Y-axis to include anything indicators plot. In some cases, an indicator may plot an erroneous value, such as 0. If the Expand range option is checked, TradeStation will show everything from the max plotted price all the way to that 0 value. That causes the price bars to get compressed.
To fix this issue, you can usually safely uncheck the Expand Range option. Then, TradeStation will set the y-axis price range based on the highest and lowest plotted price, ignoring what indicators plot.
If you want to give it just a bit more room to allow for indicators that plot slightly above/below price, you can add a buffer of space above and below the price extremes. By choosing the Sub-graph margins option (shown just below the red arrow in the following image), you can specify a buffer above and/or below those min/max range in percent. In this example, we’ve identified an extra amount of space below the minimum price by an extra 5% of the min/max range, and above the max by 10% of the range.
There are a couple of other options relating to this – one is to center the price, making the close the middle of the displayed range. The other allows you to expand the range to include any orders you may have in place, typically shown when using Chart Trading. You can experiment with these to see how they affect the automatic scaling of the price axis.
Remember that if you have an unusually distant value that’s being plotted, zooming in or panning away from that erroneous value can also make the chart go back to uncompressed bars if you can make that distant value move off the chart. For example, sometimes indicators plot unusual values in the first few bars of a chart. Making sure that you’re not having those first few bars in view might make the expanded chart get back to normal without having to adjust any Scaling tab values.
If these solutions don’t resolve the problem, one other thing to check is to make sure you haven’t accidentally put an indicator on the price chart that’s supposed to appear on a subgraph. Check through your indicators to make sure their own Scaling tab specifies a Scale On selection other than Same axis as underlying data. Choose another option in that case to see if the problem is resolved.