
If your Renko charts are slightly different from what you see in the room, there are a couple of things to check to get them better aligned.
First, remember that Renko charts are unlike time charts. Renko chart bars are placed relative to the previous bar, so if a difference occurs on 1 bar, it can affect the next bar, etc. These types of errors can accumulate over a number of bars. Since price is often the most important input to indicators, it can make notable differences in indicators, such as MQ Momentum, and MQ MZT, which rely on MQ Momentum. So it’s important that the price bars have the same highs and lows in order to get the indicators to show the same results.
Note that time bars have an advantage in this respect, in that each bar is independent from the one before it. So if there’s an error on 1 bar, it won’t affect the next like it does in Renko bars. So Renko bars are more susceptible to error accumulation than time bars.
So how do we fix this? The first thing to do is make sure that you have the correct settings and are using the same settings that the room host is using. Since some of the NinjaTrader tools we each use can be different, the input order or names might be different, so make sure that your settings are not just in the same order as far as values, but that you’re setting the correct input. One example of this is the UniRenko bar type of NT7 and NT8 can have the order of the 5-2-10 entries different. In NT7, the order is 5,2,10, while in NT8 the order is 2, 5, 10. Of course, this depends on the unirenko bar type add-on you’re using. Just make sure they’re correct, and that your charts look the same.
Since Renko bars build on the previous bar, one thing that can also affect renko is the starting bar. While it’s difficult to get the exact same start bar, it seems to help to load more bars. This may help by assuring that your chart crosses a data start point, such as the 6pm ET futures open, or perhaps even over a weekend. We have found that loading more bars (e.g. 1000 or more) helped to get the bars more aligned.
This can be even more important if your time zone is different from the room host’s time zone. In one example, a European user with a timezone difference of 7 hours was able to get better renko bar alignment by switching the renko Data Series to be based on bars rather than Days, avoiding the difference between day start times.
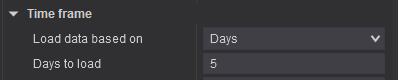
That is, in NT, change the Time Frame section of the Data Series settings from “Load data based on Days”:
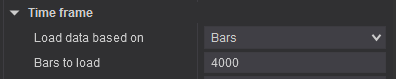
to “Load data based BARS” and choose a relatively large number of bars.
You can experiment with these settings to determine the point where you have aligned data. Perhaps using more than 5 days would help if you want to keep your data series based on Days. For example, perhaps 20 days is helpful. Remember though, the more days you load, the more memory it takes to draw and store the chart data, which is more important if you have a lot of charts open at one time. The more days you load, the longer it takes to update the chart on a symbol change, refresh, etc.
As you use your charts, make sure that you’re getting the same results as shown on the room host’s screens as a measure of alignment, and if needed, try either of the Data Series modification suggestions listed above to resolve them once you’ve confirmed your settings are correctly aligned.